APH Behind the Scenes: How Tactile Graphics are Made
Tactile graphics make visual concepts accessible by providing tactile representations of maps, diagrams, and graphs to people who are blind and visually impaired. We spoke with Tactile Graphic Designer, Sally Hart, about the creation of tactile graphics for textbooks and for the Tactile Graphic Image Library (TGIL).
Sally Hart is a Tactile Graphic Designer for the Accessible Tests & Textbook Department at APH. “I have been in this current role for 6 years, and at APH a total of 9,” said Sally. “Before taking on the responsibilities of a Tactile Graphic Designer, I was a Transcriber in the pre-production area, and originally started my APH career as a copyholder, being part of a proofreading team.”
The Accessible Tests & Textbooks Department has a 5-person editing team, which includes Sally, two braille editors, and two tactile graphic designers.
Textbook Graphics
Tactile graphics are commonly found in braille textbooks. These graphics must provide the equivalent information as the printed picture in a typical textbook. Sally explained, “No print graphic should be routinely omitted; the author’s purpose must be retained. However, not all print images are equal. Some can be adapted for tactile learning, while others are simply decorative and hold no instructive information, or do not have a tactile equivalent and therefore should be omitted.”
When she is assigned a textbook, Sally works with one of the braille editors for the quality control (QC) process, where she reviews and helps improve the readability of tactile graphics. “I study each graphic and compare it to the image in the book, making sure that all critical information is accurately conveyed tactually. My job requires knowledge of the subject matter and tactile perception, consistency, and teamwork. The sobering and exciting part of this task is knowing that all my decisions regarding a tactile graphic add up to something significant, a complete textbook, that opens a door for learning that otherwise would be closed,” said Sally.
Graphics Production
When creating a tactile graphic, you must begin by identifying the purpose of the graphic or the author’s intent behind it. Next, edit the visual information on the graphic by using simplification, elimination, distortion, and separation methods set forth in the Guidelines and Standards for Tactile Graphics. Convey the information in a raised format with area textures, linear symbols, point symbols, and braille. Afterward, proofread the finished product.
Different production methods are used depending on the type of graphic. “Your textbook will contain either thermoformed copies of collage masters, thermoformed copies of Roland masters, or Tactile Vision Green Machine prints,” said Sally. “If the production method is collage, the outsource transcriber sends in the physical graphic, often called a collage master. In contrast, the Roland printer and the Tactile Vision Green Machine pages are created in-house, on the production floor, from electronic files sent in by the outsourcer.”
The team also creates graphics for the TGIL, a free online resource for teachers and students that includes thousands of downloadable images. Sally said, “The TGIL houses electronic files only, mostly created in-house for the end-user to make a physical copy to customize and use for their needs.” Learn more by reading our TGIL blog.
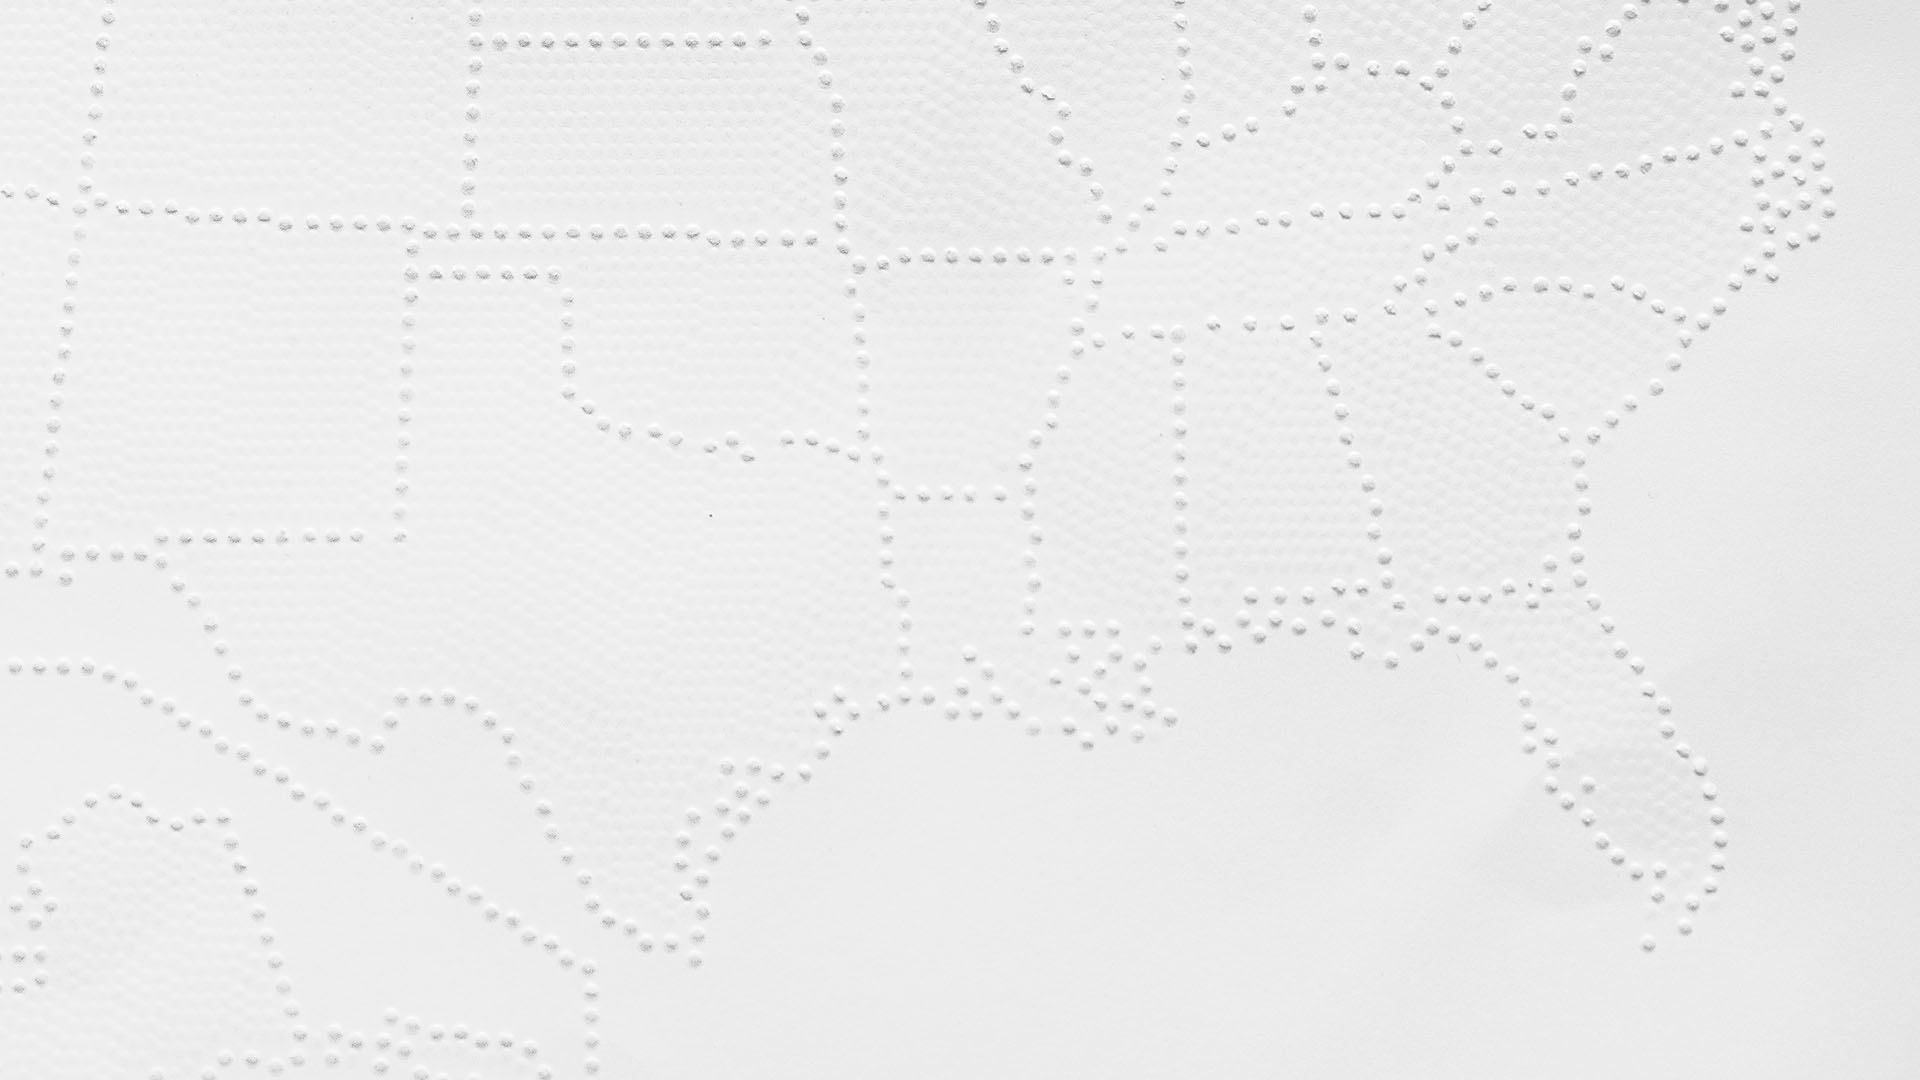
Sally’s favorite type of tactile graphic is a map. “But no matter the personal preference, the most challenging type are the complex ones,” she said. “The more lines, colors, labels, and other details an image has, the more tactually complex it is. Every tactile graphic must be produced to be read and understood by touch alone without losing necessary information.”
Reflecting on her work with APH, Sally said, “When I got into the braille field, it changed my life for the better; so my favorite part of this job is making people’s lives easier and in essence, better too. Whether it is putting a tactile graphic in the hands of a student, the look of relief on the face of a TVI after experiencing the TGIL, or training outsources to improve their tactile skills, I want to make a difference. APH has always been known for making a difference, and that is a major reason why I work here.”
Learn more about tactile graphics by listening to a related episode on our Change Makers podcast.
Share this article.
Related articles

An Inside Look at the TGIL
The Tactile Graphics Image Library (TGIL) is a free online resource that puts tactile graphics at your fingertips. Teachers, students,...