Overcoming Information Poverty, One Tactile Graphic Image at a Time
Most individuals understand tactile graphics as raised-surface representations of non-textual information, such as shapes, maps, and diagrams. Tactile graphics are often best exemplified in the math and science textbooks for blind and visually impaired students, such as the all too familiar triangles and photosynthesis cycles we all grew up with. However, increasingly information is communicated en masse through rich and interactive visuals, whether it be in the news, entertainment, or mix-media. Designed to disseminate information, ideas, and data representation, image dependency presents a level of information poverty for those individuals who cannot obtain efficient access to such information.
It has been long understood that information poverty can limit an individual’s social and economic opportunities and can lead to socio-economic and cultural exclusion, impeding individual growth and progress through an individual’s inability to navigate and access the modern information environment effectively. This is similarly true when it comes to images where complex meaning and context are shared and explored yet whose medium makes them inaccessible to the blind and visually impaired. The potential of images to convey information precisely and direct to an audience fundamentally fails to do so for the blind and visually impaired individual. Imagine navigating a foreign mass transit network without a visual map and no spatial representation or comprehending the structure and complexities of the human cell by text alone.
Tactile graphics seek to overcome the shortcomings of images for the blind and visually impaired reader through tactile communication. Chancey Fleet, assistive technology coordinator at The New York Public Library writing in the MIT Technology Review, notes that “image literacy is important, from a blind baby’s first picture book to the maps, charts, and graphics that help us understand what words fail to capture” and states further that “images are for everyone.” For younger individuals, the APH Hive module “Building Tactile Literacy Skills” relates how tactile image literacy can support braille readiness and is an important component in braille literacy development.
It is in this belief and purpose that the APH Tactile Graphic Image Library (TGIL) strives to offer tactile graphics and resources that support students, parents, teachers, and transcribers with their educational and informational needs. As a free online resource, the TGIL offers over 2,500 PDF templates which can be used to create standalone tactile graphics that can be embossed. By providing templates for good tactile designs the TGIL helps facilitate communication between those involved with the design and execution of tactile graphics. Additionally, it is also available as an app on the Monarch, APH’s multiline braille device offering Monarch users’ direct digital access to the TGIL’s growing library of image graphics on a refreshable braille display.
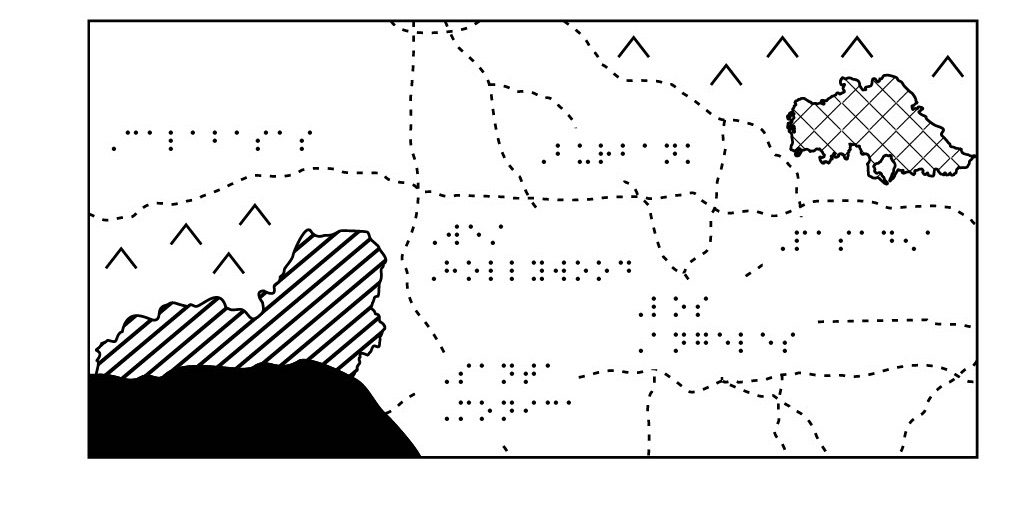
An image library that not only includes traditional graphics supporting math, science, and geography instruction and learning, but extends into literature, movies, pop culture, and current events often through TGIL users requests or graphic donations. Want a state congressional map to better understand local elections? Interested in images that supplement the Lord of the Rings novels or Star Wars movies? From a portrait of the Mona Lisa, to the profile and wingspan of an osprey, to a map of the 2025 Los Angeles fires, the TGIL seeks to educate, inform, and engage with users, and even perhaps inspire by showing an individual something for the first time.
Visit the APH Library’s Tactile Graphic Image Library page to learn more about the TGIL and click the TGIL link to register a free account to begin your TGIL journey.